家族の絆づくり、
かけがえのない思い出づくり
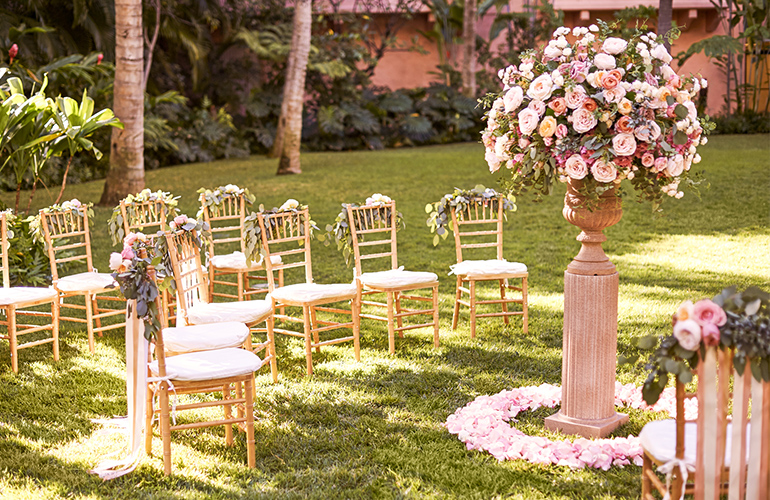
おふたりの夢がかなう、人生の大切なひととき。
永遠の愛を誓う、世界でたったひとつのウェディング。
私たちは心を込めたおもてなしで
かけがえのない思い出づくりをお手伝いいたします。
新しい人生がはじまるその日。
ご家族の思いとおふたりの思いが重なる特別な一日。
私たちはより深い家族の絆づくりの架け橋として
あたたかな幸せをつくってまいります。


PRESSプレスリリース


NEWSニュース
ABOUT
WATABE WEDDINGワタベウェディングとは?
私たちは「真心の奉仕と知恵ある提案を通じて、すてきな生活文化を創造し、心豊かな社会の実現に貢献する」という経営基本理念を掲げ、
国内外の挙式サービスや衣裳・写真事業を展開しています。
OUR SERVICE事業内容
取扱組数No.1の実績を誇るリゾートウェディングを中心に、
国内挙式・衣裳・写真・美容・ハネムーンまで、
ブライダルに関わるあらゆるサービスを融合させ多角的に展開しています。
OUR NETWORKネットワーク
ワタベウェディンググループは、国内・海外合わせて70拠点以上のグローバルネットワークを持ち、お客様に心からご満足いただけるブライダルサービスのサポート体制を整備しています。